

These are the areas of the borough where case rates have risen in the most recent period for which data is available, covering the seven days up to Saturday, March 13.
All figures are cases per 100,000 people.
Please note: Data from Public Health England is provided for each of the district's Middle layer Super Output Areas (MSOAs), which may not always tally with local authority wards.
In these confusing and worrying times, local journalism is more vital than ever. Thanks to everyone who helps us ask the questions that matter by taking out a subscription or buying a paper. We stand together. Liam Hoden, editor.
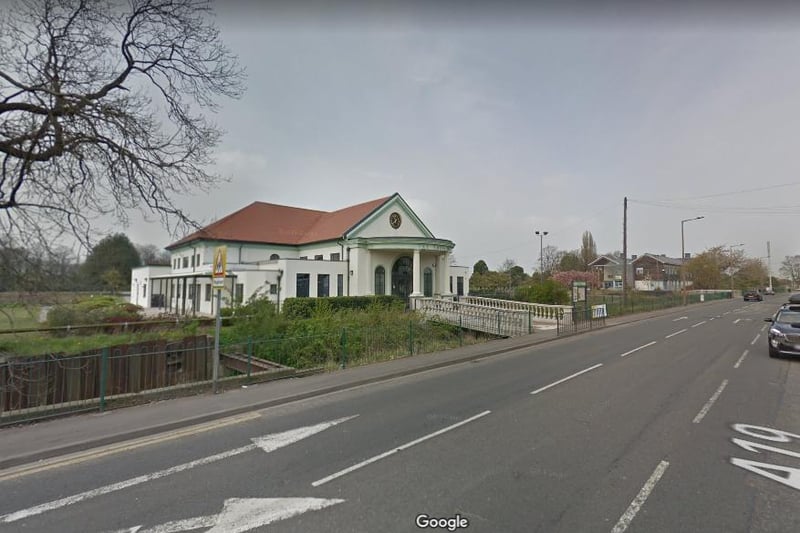
1. Bentley & Toll Bar
Bentley & Toll Bar: Week up to March 13: 208.5; Week up to March 6: 49.1 Photo: Google
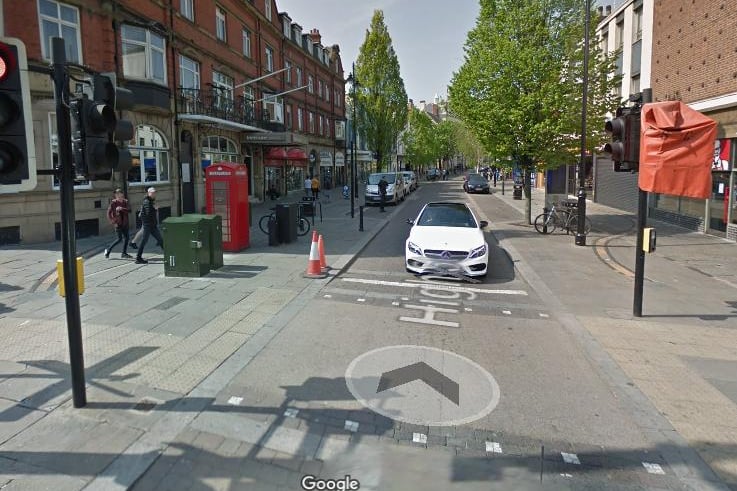
2. Central Doncaster & Hyde Park
Central Doncaster & Hyde Park Week up to March 13 231; Week up to March 6 111.8 Photo: Google
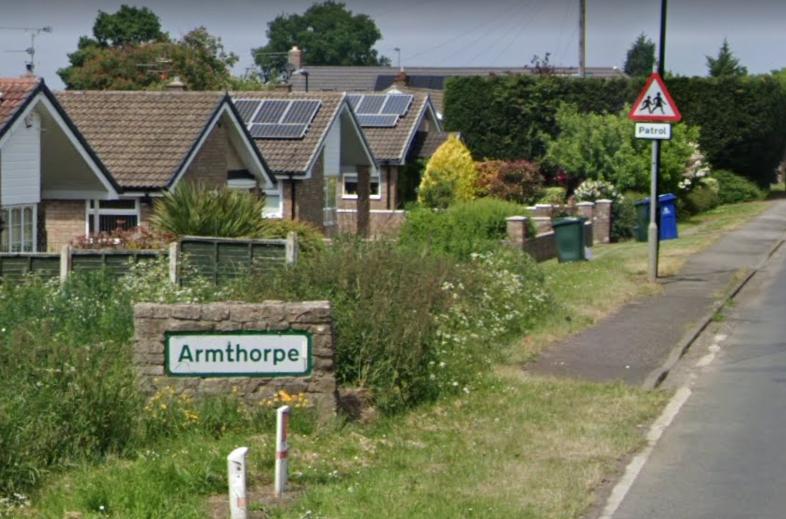
3. Armthorpe South
Armthorpe South: Week up to March 13: 208 Week up to March 6; 113.4 Photo: Google
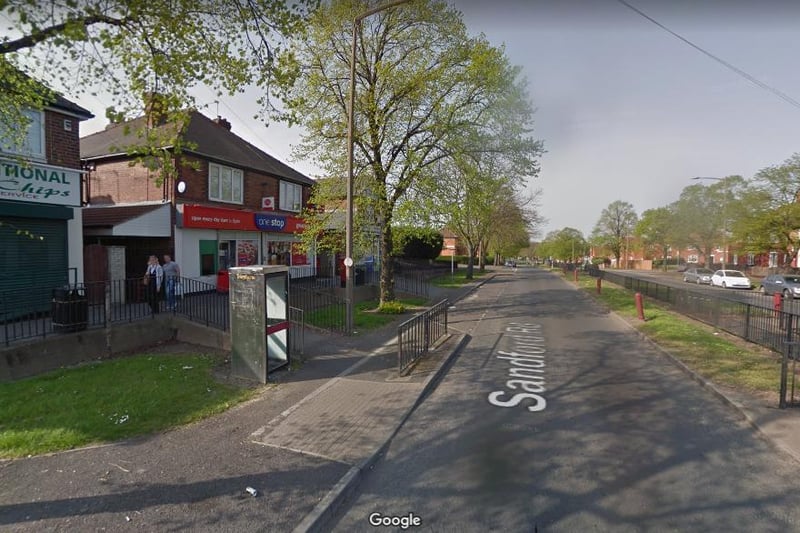
4. Balby South
Balby South: Week up to March 13 178.6; Week up to March 6 89.3 Photo: Google
1 / 4