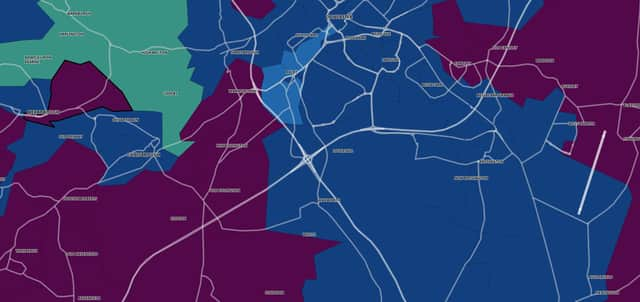
The latest NHS figures show the number of cases recorded in the seven days to November 9 and how high the rate per 100,000 is.
The case rate for Doncaster, Yorkshire & the Humber, was 341.1 - down from 398 the previous week. The UK national average is 350.
In some areas, the number of cases recorded may have fallen from the previous week, however the infection rate is still higher in these areas than in other parts of Doncaster - and the national average.
Is your area on the list?
A confirmed case is someone who has tested positive for coronavirus.
In Doncaster 148 new people had a confirmed positive test result reported on 14 November 2021.
Between 8 November 2021 and 14 November 2021, 1,075 people had a confirmed positive test result. This shows a decrease of -1.4% compared to the previous 7 days.
Figures show 12 people with coronavirus went into hospital on 7 November 2021.
Between 1 November 2021 and 7 November 2021, 47 went into hospital with coronavirus. This shows a decrease of -13.0% compared to the previous 7 days.
There were 53 patients in hospital with coronavirus on 9 November 2021.
Some people in the hospital need to use a special device called a mechanical ventilator to help them breathe.
There were 12 coronavirus patients in hospital beds with a mechanical ventilator on 9 November 2021.
There were 0 deaths within 28 days of a positive test for coronavirus reported on 14 November 2021.
Between 8 November 2021 and 14 November 2021, there have been 11 deaths within 28 days of a positive coronavirus test. This shows an increase of 10.0% compared to the previous 7 days.
Coronavirus infection rates have fallen by 15% in the past week across the UK, but remain high in certain areas.
Infection levels in Wales are the highest in the UK, and double those currently seen in London, official figures show.
Wales had 521 cases per 100,000 people in the seven days to November 10.
This is followed by South West England, with 440 cases oper 100,000, Northern Ireland, with 424 cases per 100,000, and the North East, with 422 cases per 100,000.
London has the lowest rate, at just 240 cases per 100,000 people.
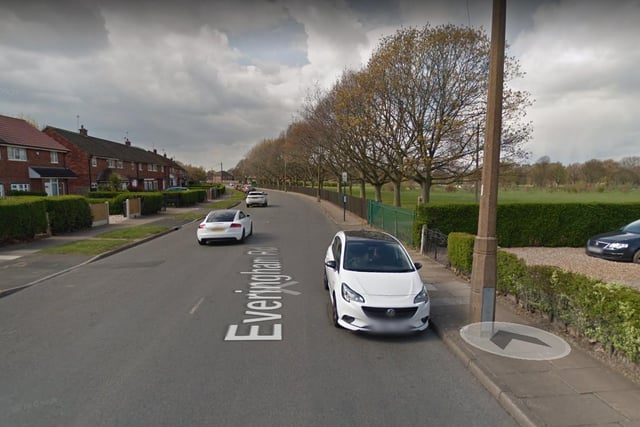
1. Old Cantley Aukley and Finningley
For the seven days to November 9 this area had a case rate per 100,000 people of 690 with a total of 55 cases, up by14 (34.1 per cent) from the previous week. Photo: Google Images
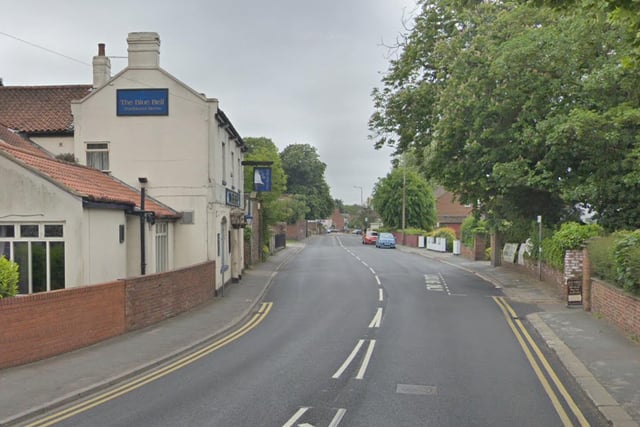
2. Hatfield West
For the seven days to November 9 this area had a case rate per 100,000 people of 563 with a total of 48 cases, up by 6( 14.3 per cent) from the previous week. Photo: Google Images
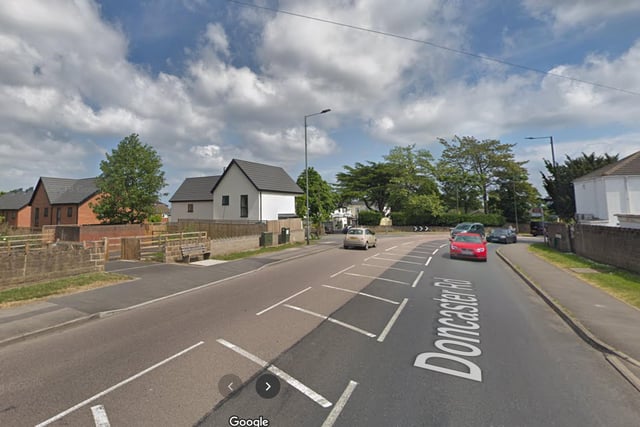
3. Armthorpe North
For the seven days to November 9 this area had a case rate per 100,000 people of 519.6 with a total of 41 cases, up by 14 ( 51.9 per cent) from the previous week. Photo: submit
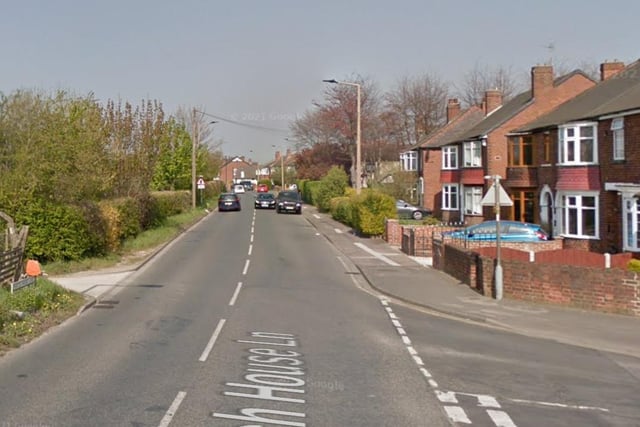
4. Bentley Rise
For the seven days to November 9 this area had a case rate per 100,000 people of 514.6 with a total of 31cases, up by 5( 19.2 per cent) from the previous week. Photo: submit
